The Template Was Built to Win

Why the Number Behind Your Acquisition Offer Has the Same Structural Gaps as the Vendor Proposal, And What That Costs You.
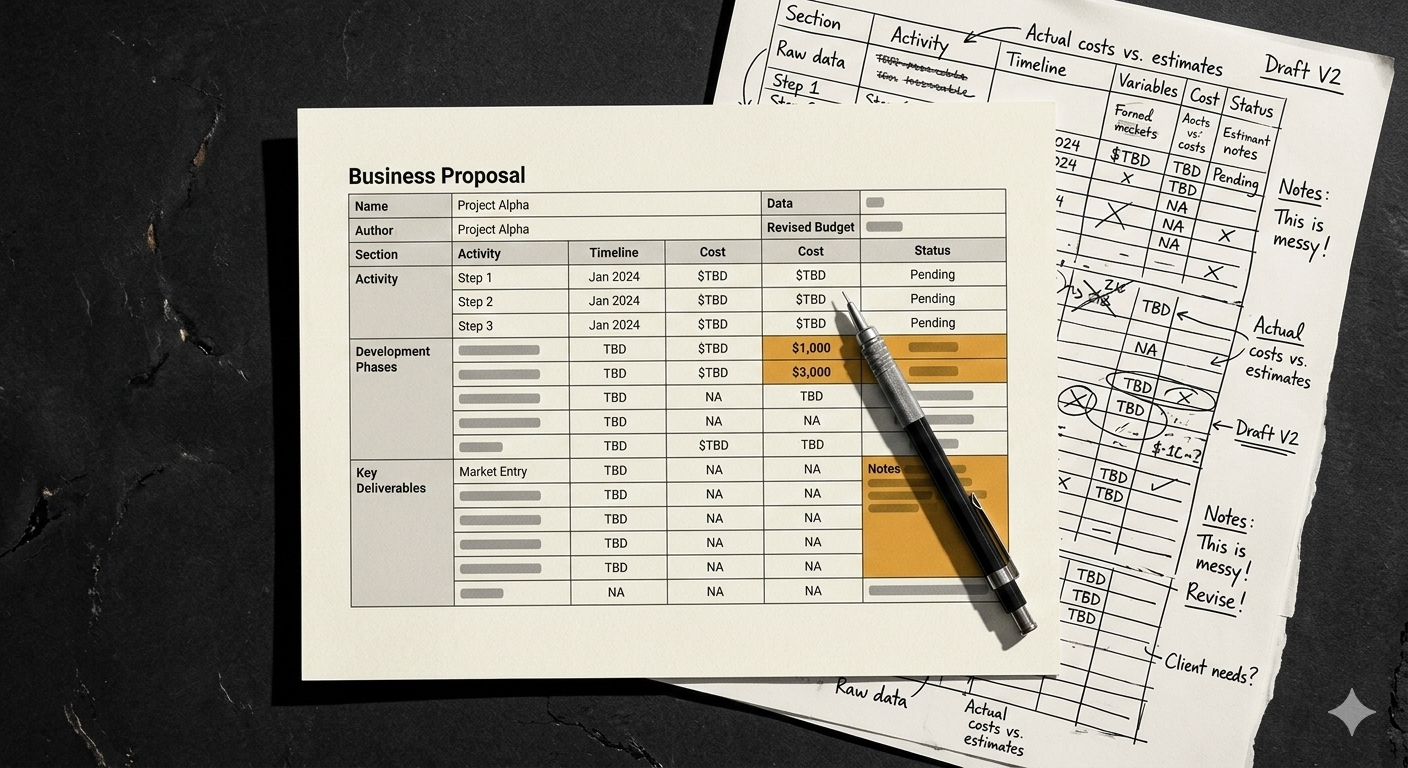
It is 11:40 pm. She has a proposal due at 9am.
The site survey data is open in one tab: 340,000 square feet, 847 SKUs in active pick, 214 current FTEs across two shifts, peak throughput of 18,400 units per day. She has the operator's WMS vendor name. She does not have, and has not been asked for, the WMS installation date.
She opens the labor savings tab. The template populates 38%. It is based on the system type entered and the headcount provided, calibrated against the vendor's reference deployments for this configuration. She reviews it. It is consistent with what the library shows. She moves to integration cost. The template returns 7.1% of base contract, the default for this system type, built from eight prior deployments where the integration came in on budget.
She is not guessing. She is engineering. The template has been refined through 47 prior submissions. It has a win rate her manager is satisfied with. Every number it produces follows from the inputs provided.
The WMS installation date would change the integration cost number significantly. The field does not exist in the template, because the template was built before that variable was identified as significant, and nobody since has had a structural incentive to add it.
At 12:40 am, she sends the proposal to the print queue. The labor savings figure reads 38%. Integration reads 7.1%. Timeline reads eleven months. Every number followed from the template. The template followed from the wins.
At 9am, the operator opens it.
Twelve months from now, a PE fund will use a version of that same model: same benchmark, same template architecture, same structural gaps, to project the post-acquisition EBITDA of a distribution business it is evaluating for a platform roll-up. The business owner receiving the offer will not know that the 38% labor savings assumption driving his valuation has a 22% first-24-month empirical median. He will not know that the number he is negotiating against was built the same way, at the same hour, from the same selected sample.
The Template Was Built to Win, Not to Warn
Every vendor automation proposal begins with a template. That template was not built from the full distribution of the vendor's deployments. It was built from the wins, from the deployments that performed well enough to become reference sites, that were completed successfully enough to be included in the proposal library, that the vendor selected because they demonstrated the product's capability at its best.
This is a rational engineering decision. A template calibrated to the reference library will produce numbers consistent with what the vendor has demonstrated. It will also systematically exclude information from the deployments that underperformed, the integration overruns that are in litigation, the throughput shortfalls that the client declined to publicize, the sites where the reference request was declined. Those deployments are real. They are not in the template.
The pre-sales engineer is not working from the vendor's full deployment history. She does not have access to it. She is working from the tools available to her: the proposal template, the reference library, the site survey data the operator provided, and her own professional judgment about where the template's defaults need adjustment. Her judgment is informed and competent. It is also bounded by the data she has been given access to.
“The template is optimized for win rate, not for predictive accuracy. Those are different objectives, and proposals built to the first standard systematically fail the second.”
The result is a model that is internally consistent and structurally optimistic. Every number follows from the assumptions. The assumptions are drawn from a selected sample. The operator receiving the proposal has no way to know this from the document itself, because the document does not disclose the sample it was built from, the deployments that were excluded, or the structural reasons why six specific cost categories are consistently understated in the same direction across every proposal produced by this process.
The PE fund building its acquisition model for a distribution business in the same sector is working from the same benchmarks. The proposal template and the acquisition underwriting model share a common ancestor: the vendor's reference library, filtered through the same incentive architecture that rewards wins and excludes the full deployment distribution.
The Six Places the Model Fails, and Why Each One Fails the Same Way
The six cost categories that are systematically understated in vendor models are not random. Each one fails for a specific structural reason tied to the template's design, the data the vendor has access to, or the commercial incentives of the pre-sales process. Understanding why each category fails is more useful than simply knowing that it does, because it tells the operator exactly what kind of independent evidence would correct each specific error. It also tells the business owner being valued against these projections exactly which assumptions are most likely to be wrong.
-
Vendor templates project 33–42% reduction in pick/pack headcount for AMR and goods-to-person systems. That range is accurate, for steady-state performance, measured at the reference sites that were selected precisely because they reached steady state successfully. What the benchmark excludes is the ramp period: the six to eighteen months of system tuning, workforce adaptation, and throughput calibration that every deployment goes through before reaching steady state. Reference sites are not selected during ramp. They are selected after it. The result is a benchmark built from the ceiling of the performance distribution, applied as a projection for the first 24 months of operation. The empirical first-24-month median across twelve actual deployments is 21–28%. The gap between 38% and 22% is not system failure. It is ramp time that the template's calibration data structurally excludes.
-
The template's integration cost assumption is calibrated to modern WMS environments, because modern WMS environments are the majority of the vendor's reference library. Legacy environments, those older than eight years, those carrying significant undocumented customization, those running on infrastructure the original vendor no longer supports, generate 3 to 5 times the integration cost of modern environments. The template does not have a field for WMS installation date. The pre-sales engineer applies the modern-environment default because it is the only tool available to her. When the operator's WMS is from 2008, that default is wrong by a factor that changes the payback model by months. The error is not negligence. It is the predictable output of a template that was built before the variable was identified as significant.
-
The vendor's Gantt chart is produced by the implementation team, not the pre-sales engineer. Implementation teams are incentivized to produce schedules that are realistic enough to be contractually defensible and aggressive enough to win the business. They are not incentivized to model the median slippage pattern across the full deployment distribution. That median, in complex deployments, is 6 to 15 months beyond the vendor's projection. The Gantt chart does not include a financial consequence for slippage, because it is a schedule, not a financial document, and adding a dollar cost for delay to the proposal document would require the vendor to model a negative outcome against itself. So the timeline is presented as a schedule. The operator reads it as a financial commitment. The two are not the same thing.
-
Year-one maintenance costs are accurately modeled in most vendor proposals, because they are covered under the standard warranty, the vendor has precise data on what they cost, and an inaccurate warranty cost projection would create a contractual problem. Year-two-and-beyond maintenance is modeled from assumption. The assumption in most templates is flat maintenance through year five, because a flat line is the simplest default and because modeling deterioration in a product during the sales process creates a presentation problem. The empirical pattern is 15 to 20 percent annual escalation from year two. Over a seven-year contract, the difference between a flat projection and an 18 percent escalation curve is a number that changes the NPV model by a figure that would have been material to the investment decision.
-
Change orders are not in the original model by definition, they arise from conditions discovered during implementation that were not visible during the site survey. But the conditions that generate change orders are consistent and predictable across deployments: integration complexity that was underestimated, infrastructure gaps that the survey did not surface, scope expansions during commissioning that the operator requested and the vendor accommodated. A model built from the full deployment distribution would include a 12 to 18 percent contingency against base contract as a baseline assumption. A model built to support a sale does not include a contingency against itself, because a contingency line item raises the total cost and compresses the projected payback period. The contingency is real. It is simply not in the document.
-
This is the only category that is not understated, it is absent. The vendor has no structural mechanism to include workforce transition costs because those costs are incurred entirely by the operator, do not appear in any document the vendor is a party to, and are not visible in the site survey data that feeds the template. The implicit assumption is zero. The HR Director at one postmortem facility spent three weeks doing what she called data archaeology, pulling payroll records, severance documentation, retraining invoices, and manager time allocation across the transition period. She produced a number: $1.224 million. No model had assigned a figure to this category before she built it. The empirical range across twelve deployments is $380,000 to $2.1 million. The median is $840,000. Every operator absorbed that cost. Every vendor proposal treated the category as nonexistent.
What the Operator Is Actually Holding
A financial model is a tool for making decisions. Its objective is predictive accuracy. The operator building a financial model is trying to find the number that most accurately reflects what will happen, including the downside, the conservative case, the scenario where the ramp takes longer and the integration costs more.
A commercial document is a tool for generating approvals. Its objective is persuasion. The vendor producing a proposal is trying to find the number that the buyer needs to see to move forward, which, in an organization with a 36-month payback threshold, is a number that comes in under 36 months. That number is produced by a template calibrated to wins, applied to a site survey that does not include the inputs that would change it, validated against a reference library that excludes the deployments it should most resemble.
Both documents can be internally consistent. Both can be produced by competent people acting in good faith. The difference is not in the character of the people who built them. It is in what each document is optimized to produce.
The operator who treats a commercial document with the analytical standards appropriate to a financial model is making a capital decision against a number that was not designed for that purpose. The operator who received the Memphis proposal was not careless. He reviewed it carefully. He asked the vendor to walk him through it twice. What he did not do was apply his own assumptions to the same six categories, from a data source that was not the vendor's reference library. His independent model, built from postmortem data rather than wins, would have produced a different number. He did not build it. The Chief Restructuring Officer's letter arrived 38 months later.
“The question is not: does this model make sense? The question is: what would my model say? The vendor provides the first one. The operator has to build the second.”
Building the Number That Isn't the Vendor's Number
The independent model uses the same six line items as the vendor’s model. The difference is the assumption behind each one, and the data source those assumptions are drawn from.
Labor savings: budget 21 to 28 percent for first-24-month planning, not 33 to 42. Integration cost: apply the legacy or modern environment range based on the actual WMS installation date, not the template default. Timeline: build a financial consequence for each month of slippage into the base case, not the optimistic scenario, the base case. Change order contingency: budget 15 percent of base contract. Workforce transition: budget $840,000 as a floor. Maintenance: escalate 18 percent from year two.
Then run the conservative scenario. Not the base case, the conservative case. The conservative case applies the high end of the empirical range to each cost category and the low end to each benefit projection. If the conservative case meets the investment threshold, the deployment may be worth pursuing. If the base case barely meets the threshold, the operator is one realistic estimate away from a 47-month payback on a 36-month policy.
Document every assumption with its source. Not 'vendor projection', 'empirical median from twelve comparable deployments.' Not 'implementation team estimate', 'base case plus nine-month contingency based on median slippage in complex deployments.' The operator who can defend every assumption in their model is in a fundamentally different conversation with their CFO than the operator who forwards the vendor's proposal with a cover note.
The same logic applies directly to the business owner preparing for an acquisition conversation. The six categories are the same. The empirical ranges are the same. The PE fund’s post-acquisition EBITDA model contains a labor savings assumption, an integration cost assumption, a timeline assumption, a maintenance cost trajectory, a change order contingency, and a workforce transition cost, and in every one of those categories, the fund’s model was built from the same selected sample as the vendor proposal. The business owner who applies the empirical ranges to those projections before the LOI arrives is building the number the fund used to price him, and finding the gap before it becomes a working capital adjustment, an earnout condition, or a price reduction in the LOI.
What NexusGate Does With This
The analytical framework in this article: the six categories, the empirical ranges, the independent model, is the intelligence side of the acquisition conversation. It tells you what the template missed, what the empirical data shows, and how to build the number the fund used to price you before you accept the number on the cover of the LOI. That analysis is free and always will be.
The introduction side is different. For business owners who have run the independent model, understand the six-category gap, and want to know which specific capital partners (PE funds, family offices, search funds) are the right fit for their business before the formal process begins, NexusGate provides that introduction.
NexusGate operates as a business introduction service, connecting qualified industrial and distribution business owners with PE investors, family offices, and search funds on a flat-fee finder model. No commission. No retainer. No Broker Relationship. The fee structure is designed for owners who want to understand the capital landscape without handing the process to an intermediary who earns more when the transaction is larger.
The owner who arrives at that conversation with an independent model, a six-category audit of his existing automation, and a documented understanding of the fund’s template gaps is presenting a different business than the owner who hasn’t done that work. NexusGate’s introduction process is built for the former.
If you have received an acquisition inquiry and want to understand which capital partners fit your business before the next call, that conversation starts at NexusGate.io.
Before You Build the Model, Run the Scan
Not every proposal warrants an independent model. Some proposals reveal their architecture in 15 minutes. Four markers, in sequence.
First: what is the integration cost as a percentage of base contract, and what is the explicit WMS assumption behind that figure? If the proposal does not name the WMS environment its integration estimate is based on, the template default was applied. If your WMS is more than eight years old, that default understates your actual integration cost by a factor the proposal does not surface.
Second: is the labor savings projection a site-specific analysis or a system-type benchmark? A site-specific analysis references your facility's current pick rate data, your shift structure, your SKU velocity distribution. A benchmark references the vendor's reference library. The difference is visible in whether the projection methodology is documented or simply stated.
Third: does the timeline include a financial consequence for slippage? If the Gantt chart has no dollar row beneath it, no monthly carrying cost modeled for delay, it is a schedule presented as a financial commitment. Those are different documents.
Fourth: does the maintenance cost trajectory escalate from year two, or does it project a flat line through year five?
Four markers. Fifteen minutes. If two or more return template defaults, the proposal was built from a selected sample rather than a site-specific analysis of your environment. That does not mean the deployment is wrong for your operation. It means the number on the cover page is not the number a rigorous independent model would produce, and the gap between those two numbers is the decision you are actually making.
The same four-marker scan applies to the acquisition offer. Replace 'integration cost' with the post-acquisition automation EBITDA assumption. Replace 'labor savings projection' with the specific deployment benchmark that projection is built from. The architecture is the same. The questions are the same. The gap between the template number and the empirical number is the same gap, whether it is on the cover page of a vendor proposal or embedded in the financial model behind an acquisition offer.
At 9am, the operator opens the proposal. The cover page has a logo, a projected ROI, and an 18-month payback figure in a font that cost the vendor's design team real money to choose. He does not know the WMS assumption on page 47. He does not know what the template field that does not exist would have produced if it did.
The pre-sales engineer is already on her next proposal. She built the model she had the tools to build. What the operator does with it is his decision.
The business owner receiving the acquisition inquiry is in the same position. The fund's model was built from the same selected sample. The assumptions have the same structural gaps. What he does with that information is his decision.
Run the scan first.